
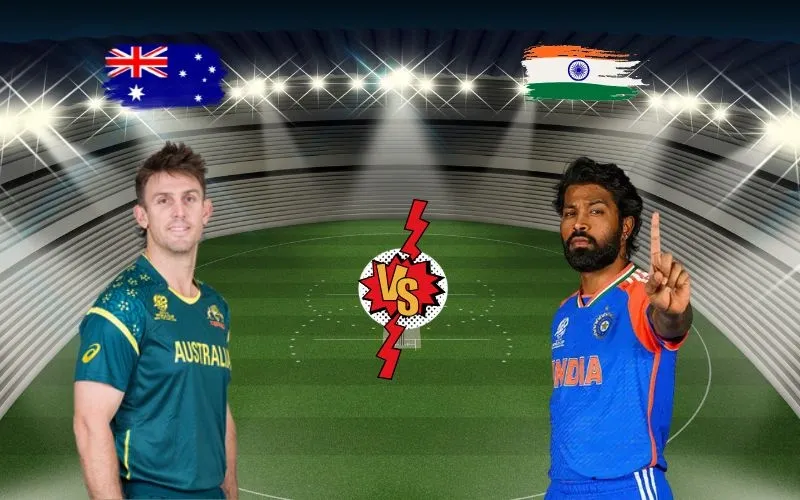
A cricket scorecard can explain an entire match without needing a long match report. cricketstatking.com can help readers explore cricket scorecards, match results, batting figures, bowling performances, player records, and team statistics through organized information. The interesting thing is that every number inside a scorecard has a purpose. Some figures explain scoring speed, others reveal bowling pressure, and a few hidden sections can completely change how people understand the game. Learning these details makes following cricket much easier over time.
Match Summary Starts Everything
The opening section of a cricket scorecard usually contains the information that identifies the game before readers look at individual performances. It often includes the competing teams, tournament name, venue, date, format, toss result, and final outcome. These details may seem simple, but they prevent confusion when teams meet multiple times during a series or tournament.
The result normally explains whether the winning side succeeded by runs, wickets, or another official margin. Some matches can finish as a tie, draw, no result, or abandoned contest depending on the conditions.
The toss information is also worth checking because it explains which captain made the first strategic decision of the match. Although winning the toss does not guarantee victory, it sometimes helps explain why the innings unfolded in a certain order.
Batting Table Shows Contributions
The batting section usually becomes the most visited part of any scorecard because it contains individual performances for every batter who entered the innings. Runs are naturally the first statistic many people notice, but the supporting numbers often provide a better explanation of the innings.
Balls faced show how long the batter remained involved. A player making 85 runs from 50 balls has played a different innings from someone making 85 from 120 deliveries.
Boundary figures can reveal how those runs were collected. Several fours may indicate steady stroke play, while multiple sixes often suggest aggressive hitting.
Strike rate adds another useful layer by measuring scoring speed. These numbers become much more meaningful when they are viewed together instead of separately.
Dismissals Explain How Wickets Fell
The dismissal column tells readers exactly how each batter left the crease. Common methods include caught, bowled, lbw, run out, stumped, and caught behind.
A caught dismissal usually lists both the bowler and the fielder involved. The bowler receives the wicket, while the fielder receives credit for completing the catch.
Run outs are different because they are generally considered fielding dismissals rather than bowling wickets.
A batter who remains at the crease when the innings finishes is shown as not out.
These details help readers connect batting statistics with bowling performances. Instead of simply counting wickets, they can see how those wickets were actually created during different phases of the innings.
Extras Build Team Scores
Extras are often overlooked, but they form an important part of every innings total. These runs belong to the team rather than an individual batter.
The common categories include wides, no-balls, byes, and leg byes. Wides and no-balls can increase the score while also creating another delivery under the relevant playing conditions.
Byes happen when the ball passes the batter without making the required bat contact. Leg byes involve specific contact with the batter’s body under cricket rules.
A small extras total may suggest disciplined bowling. A larger total can indicate unnecessary mistakes that helped the batting side increase its score.
Close matches often remind fans why this section deserves attention.
Bowling Figures Show Control
The bowling section provides statistics that help readers understand which bowlers created pressure and which ones struggled.
Common figures include overs, maidens, runs conceded, wickets, and economy rate.
Cricket over notation works differently from ordinary decimal numbers. A figure such as 7.2 means seven completed overs and two legal deliveries rather than seven point two overs.
Runs conceded show how many runs were charged to the bowler, while wickets represent dismissals credited to that player.
Economy rate measures average runs conceded per completed over.
A bowler with fewer wickets but excellent economy may still have delivered an outstanding performance by limiting scoring opportunities throughout important stages of the innings.
Fall Of Wickets Matters
The fall-of-wickets section often tells an important story that the final score cannot explain by itself.
It usually shows the team score when each wicket fell. This allows readers to identify sudden collapses, steady progress, or impressive recoveries.
Imagine a team reaching 90 without losing a wicket before quickly slipping to 110 for four. The final total might still look respectable, but the wicket sequence reveals the difficult period.
Another team could lose several early wickets before recovering through a long partnership.
These patterns become much easier to notice when readers compare the wicket sequence with batting performances and partnerships.
This small section often explains the momentum shifts that shaped the match.
Partnerships Create Stability
Cricket depends heavily on partnerships, and scorecards often include useful information about them.
A partnership represents the runs scored while two batters remain together.
Individual centuries receive attention, but another batter may have played an equally valuable supporting role during a long stand.
Large partnerships can rescue an innings after early wickets. Lower-order partnerships can also become important when teams need additional runs before the innings ends.
Repeated short partnerships usually suggest that the bowling side maintained pressure consistently.
Looking at partnerships alongside individual scores gives readers a much clearer picture of how the innings developed instead of treating every batting performance separately.
Team Totals Need Comparison
The team total is one of the most important numbers on any scorecard, but it should never be judged without context.
A total of 170 can be highly competitive in one T20 match and relatively ordinary in another.
Wickets lost, overs used, venue size, pitch behavior, weather, bowling quality, and opposition strength all influence how valuable the total actually is.
A score such as 170 for three suggests a different batting performance from 170 all out.
The scorecard becomes more useful when readers compare these surrounding statistics before deciding whether the batting side performed strongly or simply benefited from favorable conditions.
Targets Shape Second Innings
Once the second innings begins, the target becomes the most important reference point for readers.
If the first team scores 185 runs, the chasing side generally needs 186 under normal circumstances.
The scorecard often displays current score, remaining runs, wickets available, and overs left.
These numbers help explain how comfortable or difficult the chase has become.
A team needing twenty runs from thirty deliveries with several wickets remaining is usually in a stronger position than another team needing the same runs from twelve deliveries.
The final winning margin can also reveal whether the chase was comfortable or extremely close.
Target information becomes even more useful when combined with required run rate.
Run Rate Tracks Progress
Run rate measures how quickly a team scores during an innings.
This statistic becomes especially valuable in limited-overs cricket because teams have a fixed number of overs available.
During a chase, required run rate shows how quickly the batting side must score to reach the target before the overs disappear.
Several quiet overs can increase the pressure quickly. A few boundaries can then reduce that pressure again.
Readers should compare current run rate with required run rate while also checking wickets remaining.
Run rate does not predict the result, but it explains whether the batting side is keeping pace with the chase or beginning to fall behind.
Strike Rate Changes Meaning
Strike rate gives another useful perspective on batting performance.
It generally represents runs scored for every hundred balls faced.
A player scoring 40 runs from 20 balls has a strike rate of 200, while another player scoring the same 40 from 50 balls has a much lower figure.
Both players reached the same score, but their contributions affected the innings differently.
Strike rate becomes particularly important in T20 cricket because teams have limited deliveries available.
ODI cricket also rewards useful scoring speed, while Test cricket requires a more balanced interpretation because spending time at the crease can sometimes be equally valuable.
Powerplay Overs Matter
Powerplay overs often shape the direction of limited-overs matches, even though they occupy only part of the innings.
During these overs, fielding restrictions create different scoring opportunities for batters.
A strong powerplay can give the batting side confidence for later overs. Early wickets during the same period can create pressure that lasts much longer.
Some scorecards provide over-by-over information that helps readers examine this phase more carefully.
Comparing powerplay scoring between two teams can reveal why one side built a stronger foundation before the middle overs even began.
Middle Overs Decide Pressure
The middle overs may appear quieter than the opening or finishing stages, but they often decide whether a team builds momentum or loses control.
Batters usually rotate the strike while trying to preserve wickets.
Bowlers often focus on restricting boundaries and creating pressure through consistent lines.
A scorecard can reveal this period through partnership growth, strike rates, and run rate changes.
Teams that manage the middle overs effectively often create better opportunities during the final overs.
Ignoring this stage can make the final score appear more surprising than it actually was.
Death Overs Change Results
The final overs frequently produce dramatic changes in limited-overs cricket.
Batters usually attack aggressively because few deliveries remain.
Bowlers must balance wicket-taking attempts with run prevention.
Economy rate during this stage can differ significantly from earlier overs because batters are taking greater risks.
A scorecard may show rapid scoring through boundaries, quick wickets, or both.
Readers who compare the final overs with earlier stages can understand whether the batting side finished strongly or whether the bowling attack maintained control under pressure.
Test Cricket Needs Patience
Test scorecards contain more information because each team can potentially bat twice.
Readers may need to examine four innings before understanding the complete result.
Declarations, follow-on situations, innings leads, and remaining wickets all become important.
A batter can produce two very different innings within the same match.
Bowlers may also experience changing pitch conditions across several days.
Instead of focusing only on the biggest individual score, readers should compare contributions across both innings to understand which performances actually influenced the final outcome.
Fielding Creates Big Moments
Fielding statistics can reveal valuable contributions that are easy to overlook.
Some scorecards include catches, stumpings, and run outs.
A difficult catch can remove a dangerous batter at exactly the right moment.
A direct-hit run out can completely change a chase within seconds.
Wicketkeepers also contribute through catches and stumpings while supporting bowlers throughout the innings.
Fielding information may not appear in the same detail across every competition, but it deserves attention whenever it is available because cricket depends on all three major skill areas.
Player Comparisons Need Balance
Scorecards make player comparisons simple, but fair comparisons require context.
Opening batters usually receive more opportunities than lower-order players.
Death bowlers often concede more runs because opponents attack heavily during the closing overs.
A batter scoring thirty quick runs may influence a T20 chase more than someone making fifty from many more deliveries.
Similarly, a bowler taking one wicket with excellent economy can create pressure that helps teammates collect wickets later.
Readers should combine statistics with player roles instead of relying only on raw numbers.
Accurate Numbers Build Trust
Accurate scorecards are essential because cricket fans often know the important numbers already.
Incorrect runs, wickets, overs, player names, or extras can reduce confidence immediately.
Calculated figures such as strike rate and economy rate also deserve careful checking because one incorrect value can affect several other statistics.
Live scorecards require regular updates, while completed scorecards should reflect the official final result.
Reliable information helps readers compare players, follow tournaments, and review completed matches without unnecessary confusion.
Accuracy always matters more than adding extra numbers that have not been verified.
Final Thoughts On Scorecards
Cricket scorecards provide much more than a final result because they explain how a match developed through statistics and individual performances.
Batting figures show runs, balls faced, boundaries, and strike rate, while bowling figures reveal overs, wickets, runs conceded, maidens, and economy.
Extras explain additional team runs, partnerships show how batters worked together, and fall-of-wickets information highlights important momentum changes.
Targets, required run rate, and remaining overs help readers understand pressure during a chase.
T20, ODI, and Test scorecards all require slightly different interpretation because each format creates different strategic demands.
Fielding statistics can add another valuable layer whenever catches, stumpings, and run outs are included.
Once readers become comfortable with these sections, scorecards become one of the easiest ways to compare performances, follow tournaments, and understand cricket beyond the headline result.
Read also :-
लखनौ सुपर जायंट्स वि मुंबई इंडियन्स सामन्याचे स्कोअरकार्ड
australian men’s cricket team vs sri lanka national cricket team match scorecard
sri lanka national cricket team vs england cricket team match scorecard
england cricket team vs sri lanka national cricket team match scorecard
india national cricket team vs netherlands national cricket team match scorecard